Sales reporting that actually drives revenue
See what’s working. Fix what isn’t.
Enhanced sales visibility
Get instant clarity into pipeline and deal progress.
Data-driven decision making
Use real-time insights to guide every decision.
Performance optimization
Track reps, coach smarter, and boost team output.
Streamlined reporting
Replace spreadsheets with built-in, customizable reports.

Reporting designed to move deals forward
Analyze easy-to-read pipeline data
Coach sales reps better with the right reporting

Flag stuck deals before they go cold or churn
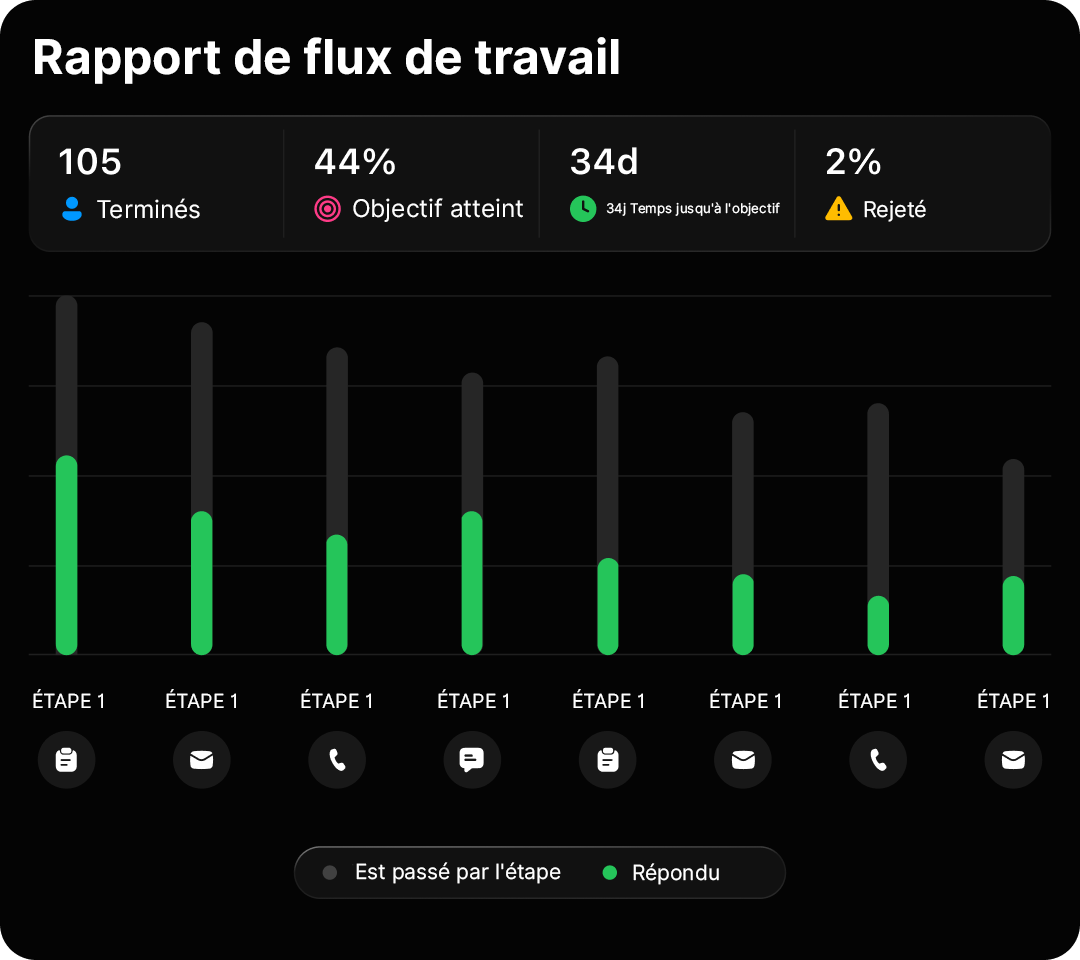
Refine your workflows using data, not guessing
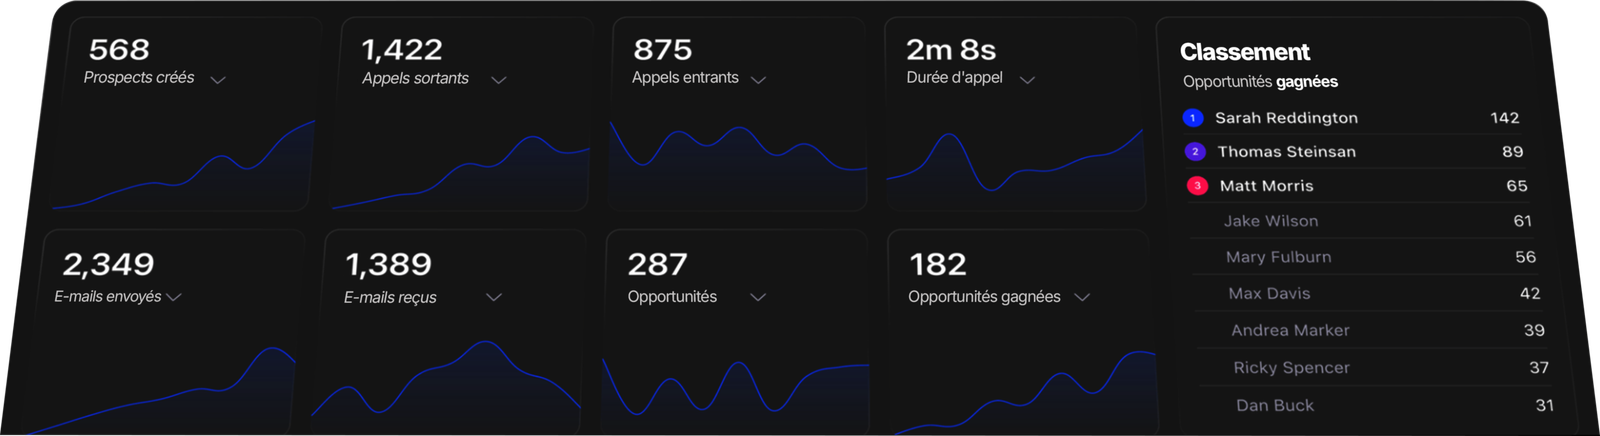
Clear, easy-to-read sales data without dashboard digging
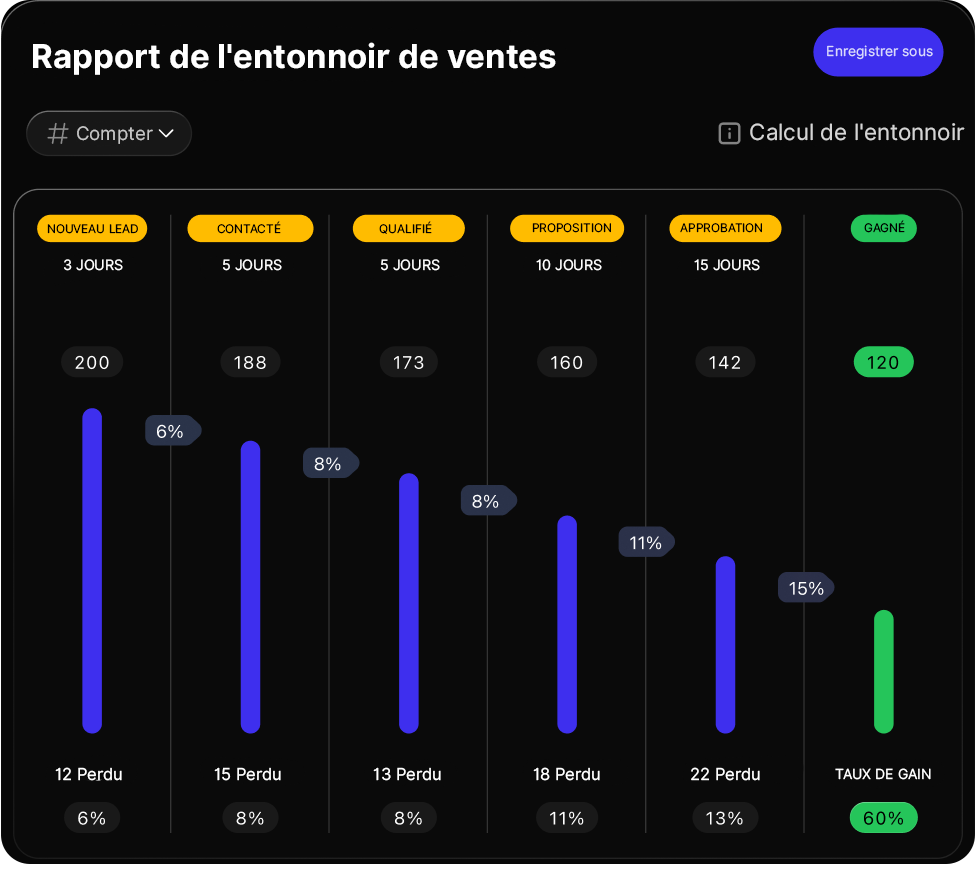
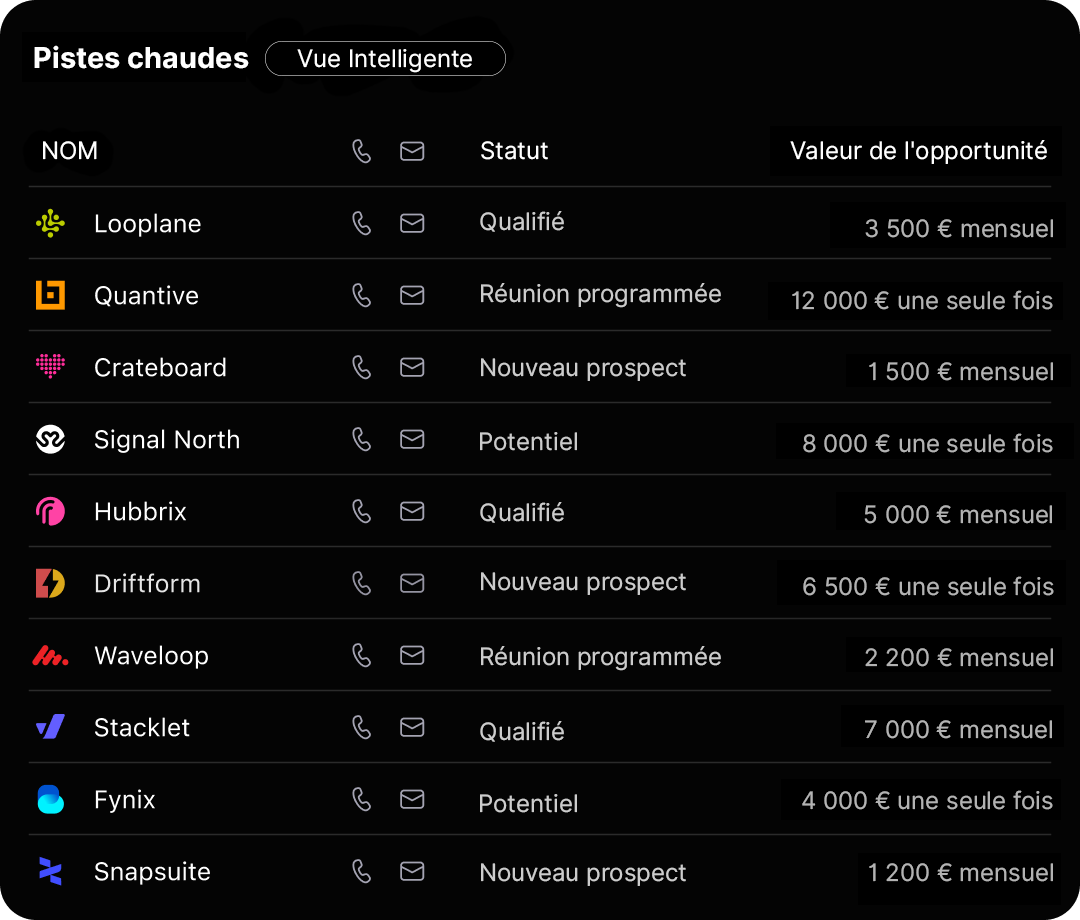
Opportunity Reporting
Track deals by stage, expected close date, and value. Spot pipeline gaps, estimate potential revenue, and focus your team on high-impact deals.
Pipeline Stage Reports
See how many deals are in each stage of your sales flow. Spot friction points and keep your pipeline moving forward.
Custom Pipeline Views
Break down your pipeline by team, rep, source, or product line. Drill into the details that drive performance and pinpoint what’s working where.
Expected Revenue Views
Forecast revenue with precision. Use expected close dates and deal values to project both near-term and long-term revenue.
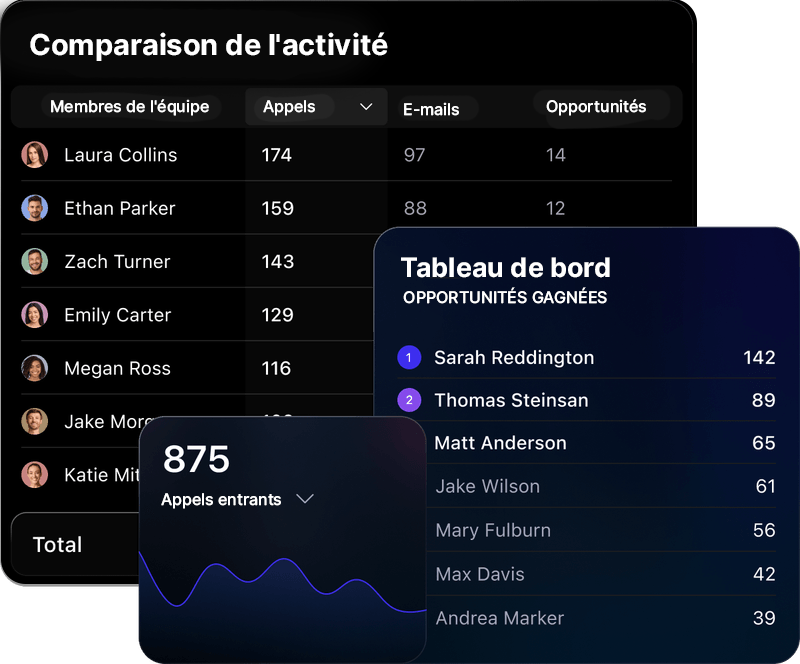
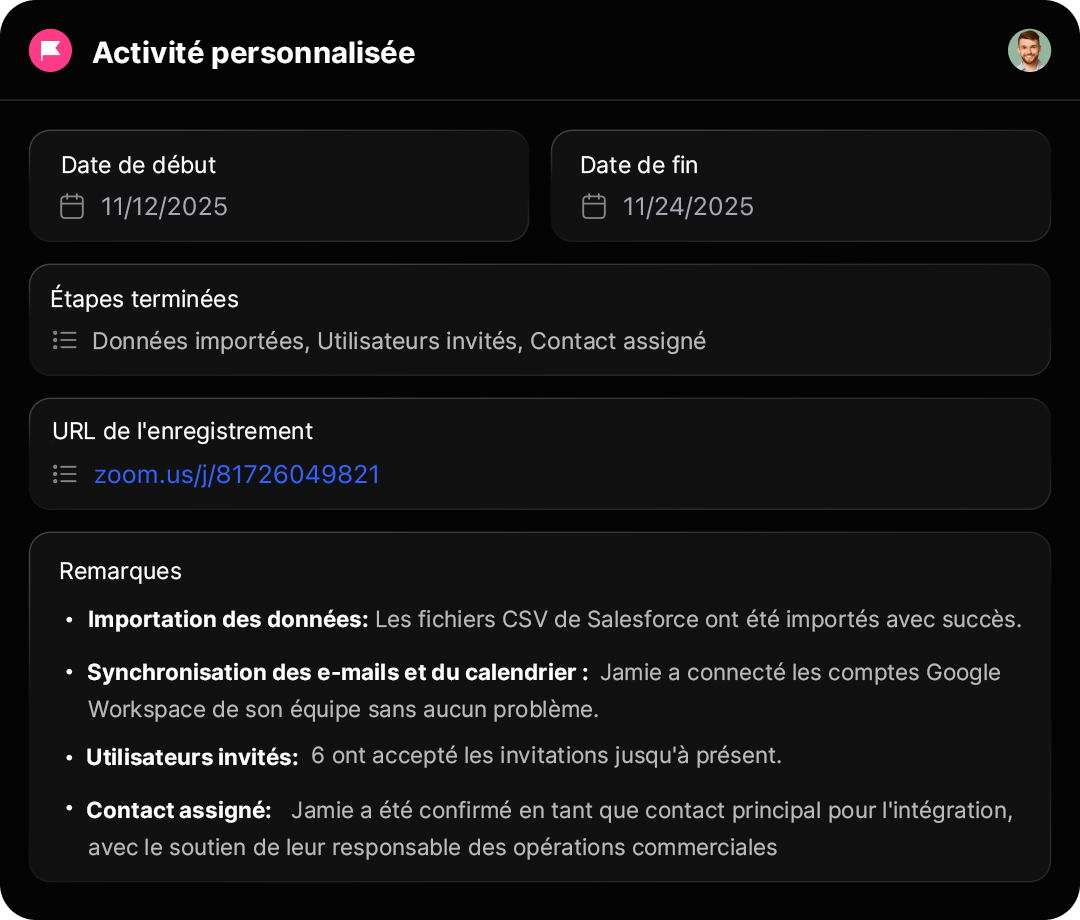
Activity Reporting
Track deals by stage, expected close date, and value. Identify pipeline gaps, estimate potential revenue, and focus your team on high-impact opportunities.
Rep-Level Reporting
See how each rep is performing in deals closed, activity volume, and conversion rates. Use this data to coach more effectively.
Leaderboards & Comparisons
Make rep performance visible to the whole team. Encourage healthy competition and give everyone a reason to level up.
Conversion Rate Tracking
Track how reps convert leads across the funnel. Spot skill gaps and coach with precision to boost close rates.
Custom dashboards
Create dashboards for different teams, roles, or goals. Combine activity, pipeline, and revenue data into a single view built around what matters most.
Real-time data
No refresh. No delay. Reports update automatically so you always work with up-to-date data — perfect for leadership check-ins.
Saved reports and filters
Quickly access your favorite reports. Filter by lead owner, status, source, or custom fields, then save views to revisit later or share with your team.
Easy sharing
Keep everyone aligned. Share insights in meetings, send CSV exports, or present live dashboards without relying on ops support.
9 out of 10 new users start using Gax to place calls, send emails + texts, or host a meeting within their first week.

Questions fréquemment posées
Gax provides flexible reporting to track team activity, sales performance, pipeline health, and lead conversion. You can view key metrics through customizable charts and dashboards, or dig into detailed views using filters and date ranges to get exactly what you need.
Yes. You can create multiple dashboards for different use cases — such as rep performance, pipeline forecasting, or executive summaries. Dashboards are easy to share, and each team member can pin the ones most relevant to their role.
Absolutely. Gax reports update in real time, so your dashboards always reflect the latest calls, emails, opportunities, and sales results. There’s no need to manually refresh or export.
Not at all. Gax reporting is built for sales teams, not data analysts. You don’t need SQL or spreadsheets — everything works with simple clicks so anyone can explore data and get actionable insights.
Yes. You can export reports as CSV for deeper analysis, or share visual dashboards via screenshots or screen sharing. This makes it easy to keep leadership, clients, or stakeholders informed — even if they don’t use Gax.